Geopolitical Competition: The Future of US – China Global Relations
- Oct 06, 2026
- 13 Views
Geopolitical Competition: The Future of US – China Global Relations
The United States and China have emerged as one of the top bilateral trade regions of the global marketplace, backed up by tariff hikes and export restrictions, as reported by U.S. Trade Data. The trade valuation of both regions is at a staggering rate of 404.6 billion U.S. dollars.
The United States ' exports to China are valued at 106 billion U.S. dollars, with a decline of 26%, whereas the imports amounted to 308.7 billion U.S. dollars, with a decline of 29.9%. The trade deficit of both economies has amounted to 202.7 billion U.S. dollars. The monthly indication of the factors has impacted the tariffs.
Chinese imports were valued at 41.8 billion, with a subsequent decrease of 18.9 billion in June 2025. The momentum has again spiked to around 20 to 26 billion U.S. dollars per month after that. The total trade between the United States and China is at a valuation of 494.6 billion U.S. dollars, whereas the export services to China are at a staggering rate of 57.2 billion U.S. dollars, and economic services have been imported at 22.8 billion U.S. dollars. In order to address such concerns, businesses monitor the impact of the US Import Data and US Trade Statistics Data.
US – China Trade Summary
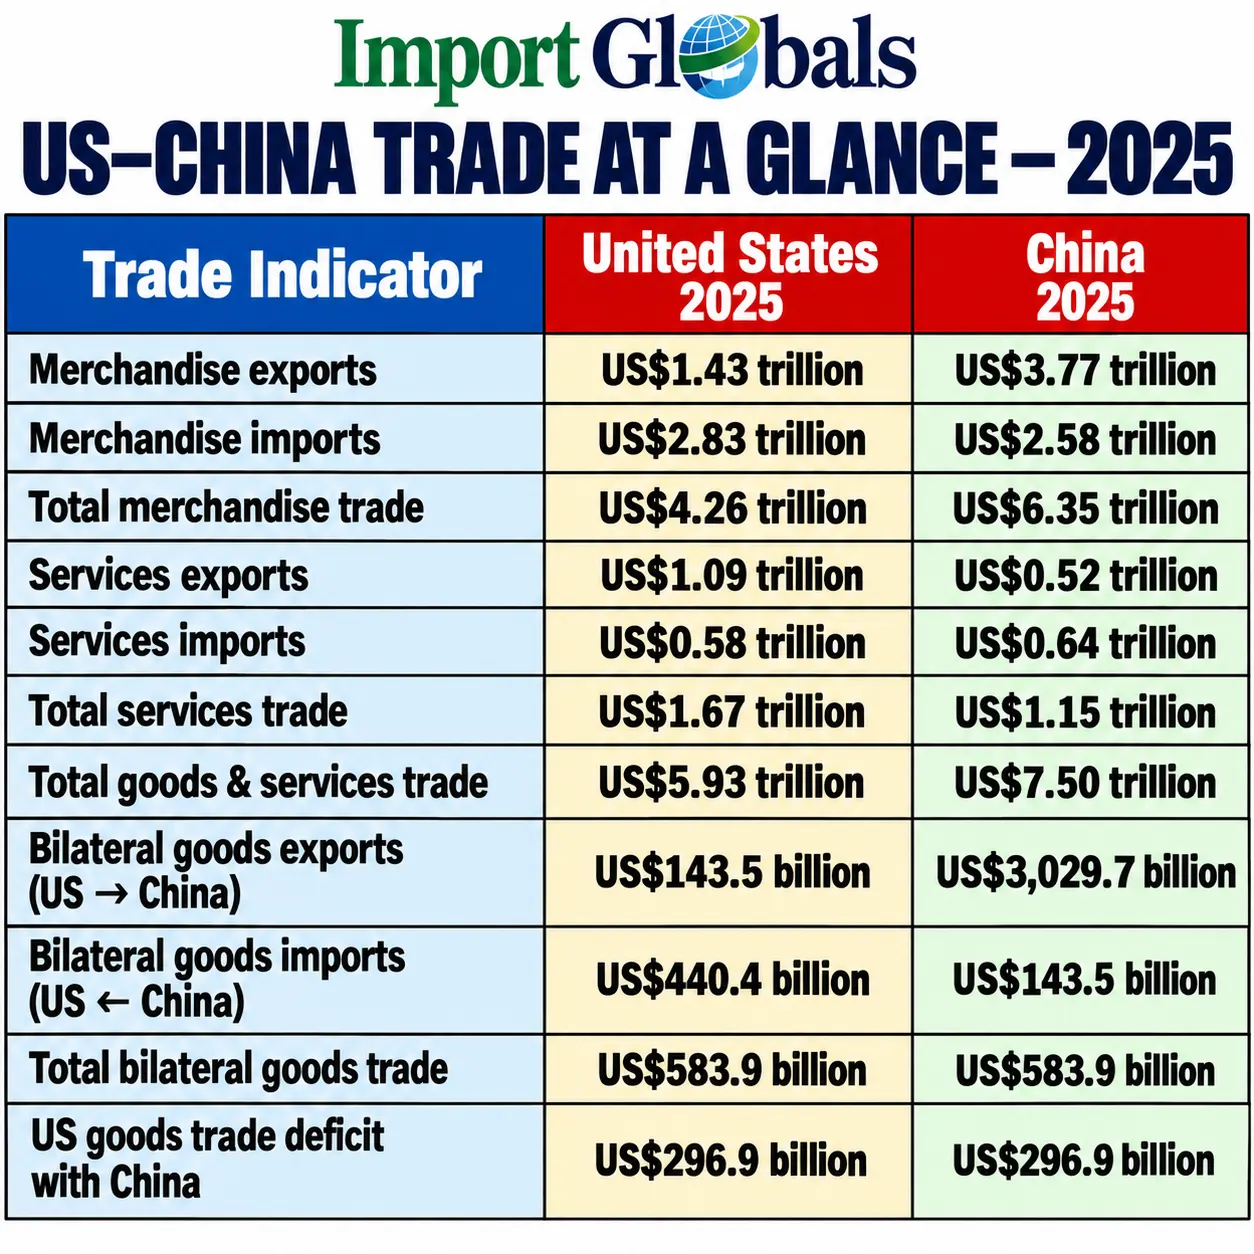
The US-China Trade presents an overview of trade patterns and size between the most important economies around the world. More specifically, comparisons are made in terms of merchandise trade (including both exportation and importation), services trade, and general trade. In 2025, the USA recorded about US$1.43 trillion in merchandise exports and US$2.83 trillion in merchandise imports, meaning that overall merchandise trade amounted to US$4.26 trillion. At the same time, China has a considerably higher figure in merchandise trade (around US$3.77 trillion in exports and about US$2.58 trillion in imports, totalling US$6.35 trillion in terms of merchandise trade).
The infographic makes an important point about services trade, where services play a significant role in both mentioned economies. US trade in goods and services amounted to about US$5.93 trillion, and China's trade in goods and services amounted to $7.50 trillion.
The US exported goods worth approximately US$143.5 billion to China, reported China Export Data. At the same time, US imports from China came to around US$440.4 billion, making total bilateral goods trade of about US$583.9 billion. This information confirms that the US has a significant goods trade deficit with China valued at approximately.
Top Goods US Imports From China
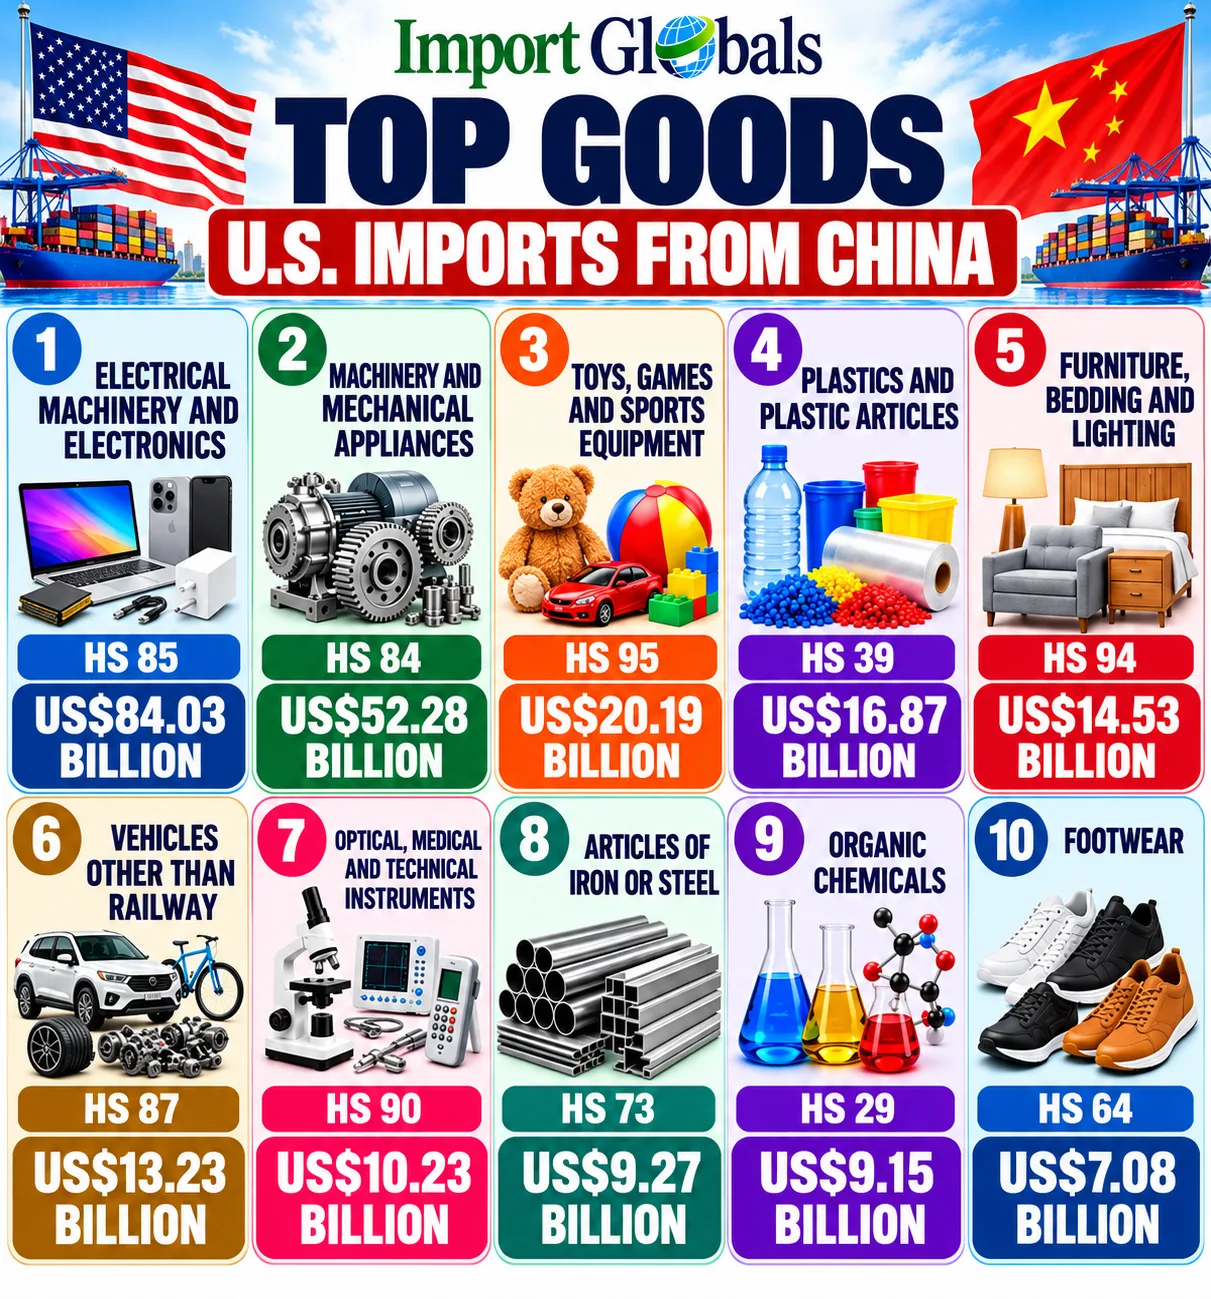
1. Electrical Machinery and Electronics (HS 85): US$84.03 Billion
Smartphones, laptops, batteries, chargers, transformers, and semiconductors represent the most substantial import category from China. Most of the retailers in the U.S. are dependent on the import of electrical machinery and electronics because of the volume and competitive pricing.
2. Machinery and Mechanical Appliances (HS 84): US$52.28 Billion
Machinery and mechanical appliances are the second-largest imported category from China to the U.S. Computers, data processing components, and pumps and valves are some of the top sourced essentials. The manufacturing offices and companies are mainly operating in the U.S. because of its reliance on these products and goods, with machinery as the second-largest import from China, says US Customs Data.
3. Toys, Games, and Sports Equipment (HS 95): US$20.19 Billion
The Chinese authorities have mainly traded toys, games, and sports equipment worth a valuation of 20.19 billion U.S. dollars to the U.S. in 2025. The buyers and sellers are mainly interested in providing these products because of the response to seasonal fluctuations, which makes them look important for the suppliers in other Asian nations.
4. Plastics and Plastic Articles (HS 39): US$16.87 Billion
Plastics and derivatives are the fourth-largest imported category of the United States from China. Packaging materials, household items, tubes, and industrial devices are forming the third largest group of imports. Different sectors are mainly utilizing plastics and high-import polymers for processing the production volume, which makes China an attractive trade partner.
5. Furniture, Bedding, and Lighting (HS 94): US$14.53 Billion
Furniture, bedding, and lighting products provide solutions for housing, retail, and hospitality. Products of this category include seating devices, cabinets, and light sources where anti-dumping taxes have had an influence on sourcing and pricing in this area.
6. Vehicles Other Than Railway (HS 87): US$13.23 Billion
The main categories of goods in this area are vehicle accessories, components, bicycles, and electric vehicle items. It should also be noted that suppliers and manufacturers of these products have to deal with restrictions imposed by tariffs and other measures, reported US Shipments Data.
7. Optical, Medical, and Technical Instruments (HS 90): US$10.23 Billion
Medical instruments, optical devices, measuring devices, and testing equipment are part of this group of goods. In this area, service providers in the healthcare and manufacturing sectors use these goods since they offer high precision and low production costs.
8. Articles of Iron or Steel (HS 73): US$9.27 Billion
Essentially, in this segment, fasteners, plumbing fittings, tools, and various steel fabrication products are included. Construction, manufacturing, and energy industries use these goods quite broadly; however, there are steel duties and measures in the field of trade that affect the work in this area.
9. Organic Chemicals (HS 29): US$9.15 Billion
Organic chemicals, mainly solvents, intermediates, and components in pharmaceutical manufacture, are sourced from China. Organic chemicals are at a staggering import valuation of 9.15 billion U.S. dollars; The overwhelming majority of U.S. producers have maintained the reasonable trade of these input materials.
10. Footwear (HS 64): US$7.08 Billion
Large quantities of shoes, sandals, and boots continue to fill American warehouses. US companies are not only sourcing from China, but they have also started to look for production opportunities in Vietnam and elsewhere.
Top Goods US Exports to China in 2025
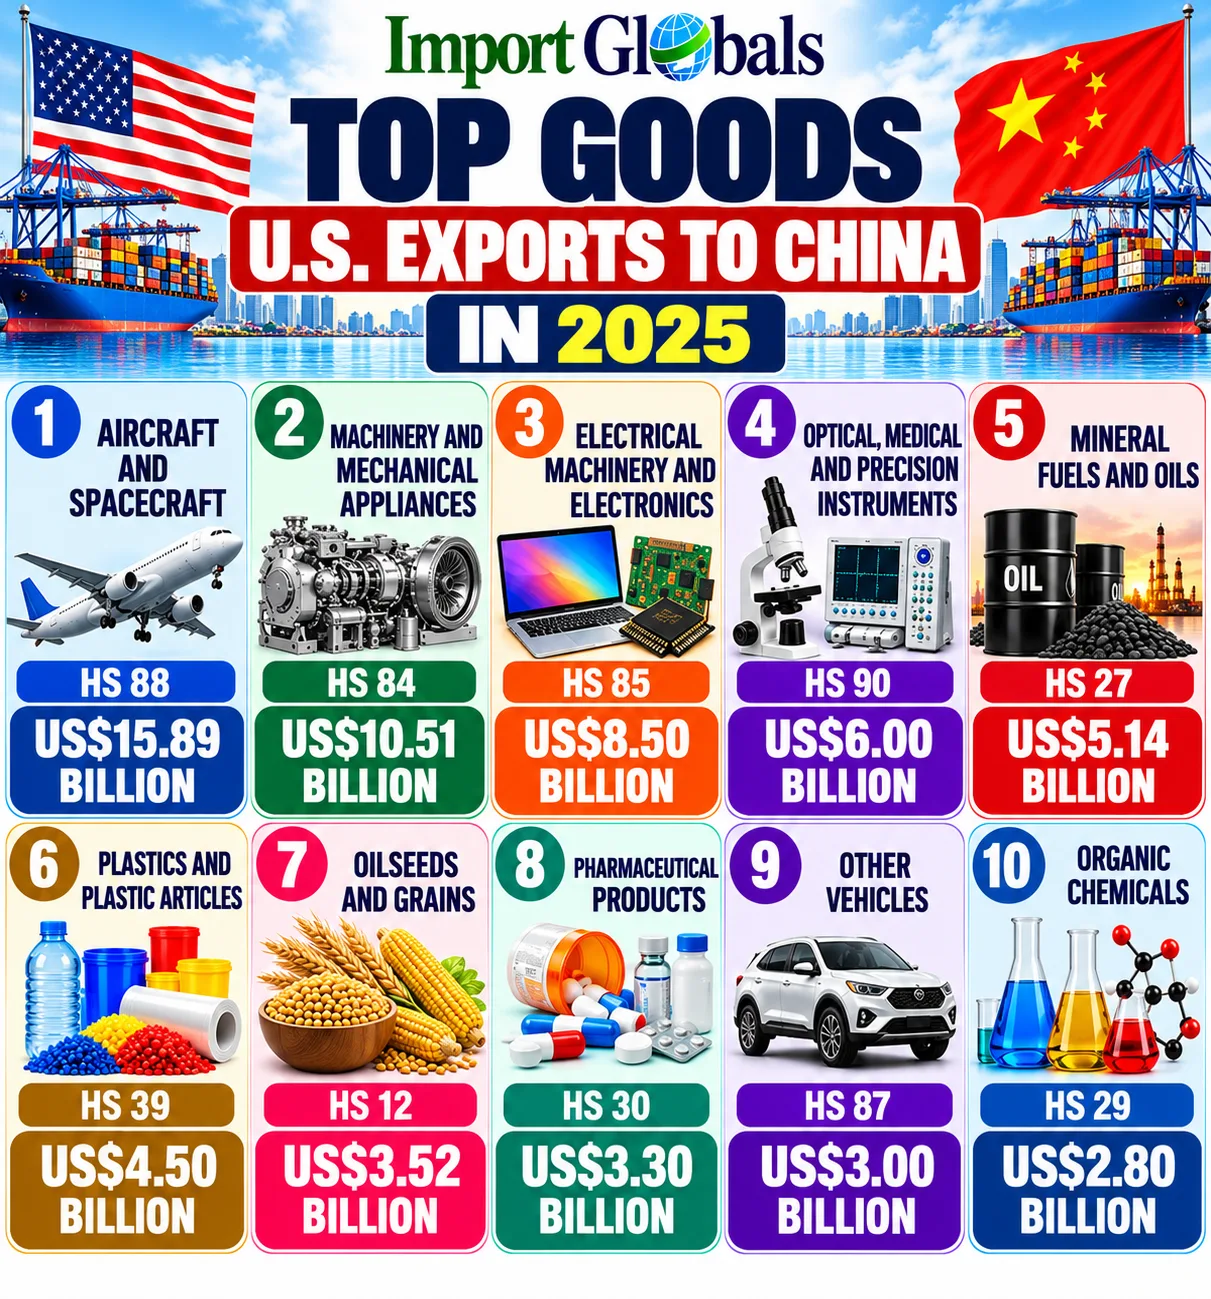
1. Aircraft and Spacecraft (HS 88): US$15.89 Billion
The United States exports the most aircraft, engines, and equipment to China. Whether it is civil passenger planes or parts, Chinese airlines have been ordering planes and parts from the Americans despite the trade tensions between the two countries.
2. Machinery and Mechanical Appliances (HS 84): US$10.51 Billion
Machinery and mechanical appliances are the top exported variants of the United States to China. The category mainly encompasses industrial devices, engines, turbines, and equipment for making semiconductors. The specific equipment helps Chinese enterprises with shipments and their limitations because of the tariffs and export restrictions.
3. Electrical Machinery and Electronics (HS 85): US$8.5 Billion
Major exports in the chapter are integrated circuits, electronic devices, and electrical machinery. They are used by Chinese companies in making goods and devices for foreign markets; nevertheless, restrictions prevent some advanced chips and components from being exported.
4. Optical, Medical, and Precision Instruments (HS 90): US$6.0 Billion
Medical devices, scientific instruments, and testing equipment have a high value and are some of the top exported variants of US to China in 2025. Hospitals, laboratories, and research centres in China are interested in buying them; because of their high quality and technology.
5. Mineral Fuels and Oils (HS 27): USD 5.14 Billion
The category includes crude oil, liquefied natural gas, ethane, and refined products. Energy exports have quickly shifted to China as a result of the tariffs imposed and trade policy; thus, these exports may change rapidly on a monthly basis.
6. Plastics and Plastic Articles (HS 39): USD 4.5 Billion
The category consists of polymers like polyethylene and others used in packaging and consumer goods, as well as manufacturing in China. U.S. petrochemical industry has great benefits from using less expensive feedstock, but the tariffs negatively affected its price competitiveness in the market, says China Import Data.
7. Oilseeds and Grains (HS 12): USD 3.52 Billion
Soybeans are the first among the listed categories, which were exported to China for USD 3 billion in 2025 (USDA). The export volumes are far lower than the historical ones because of tariffs, although Chinese state-owned companies have started purchasing again under the trade agreement.
8. Pharmaceutical Products (HS 30): USD 3.3 Billion
The product category is related to medicines, vaccines, and biologics. The demand from Chinese customers and medical institutions for medicines gives an opportunity for further exports, especially for innovative treatments developed by American manufacturers.
9. Other Vehicles (HS 87): US$3 Billion
Passenger cars and other vehicles are worth an export valuation of 3 billion U.S. dollars in 2025. The tariffs imposed by the Chinese authorities on U.S. products have maintained the development of local brands, while resulting in a fall in demand for American cars.
10. Organic Chemicals (HS 29): US$2.8 Billion
Among the top exported variants of the United States to China, organic chemicals are at the tenth position. Chemical intermediates, salts, and pharmaceutical ingredients are forming an integral part of U.S. exports to China. The US serves as one of the major exporters in the organic chemicals industry.
US-China Trade of the Past 10 Years: The Statistical Analysis
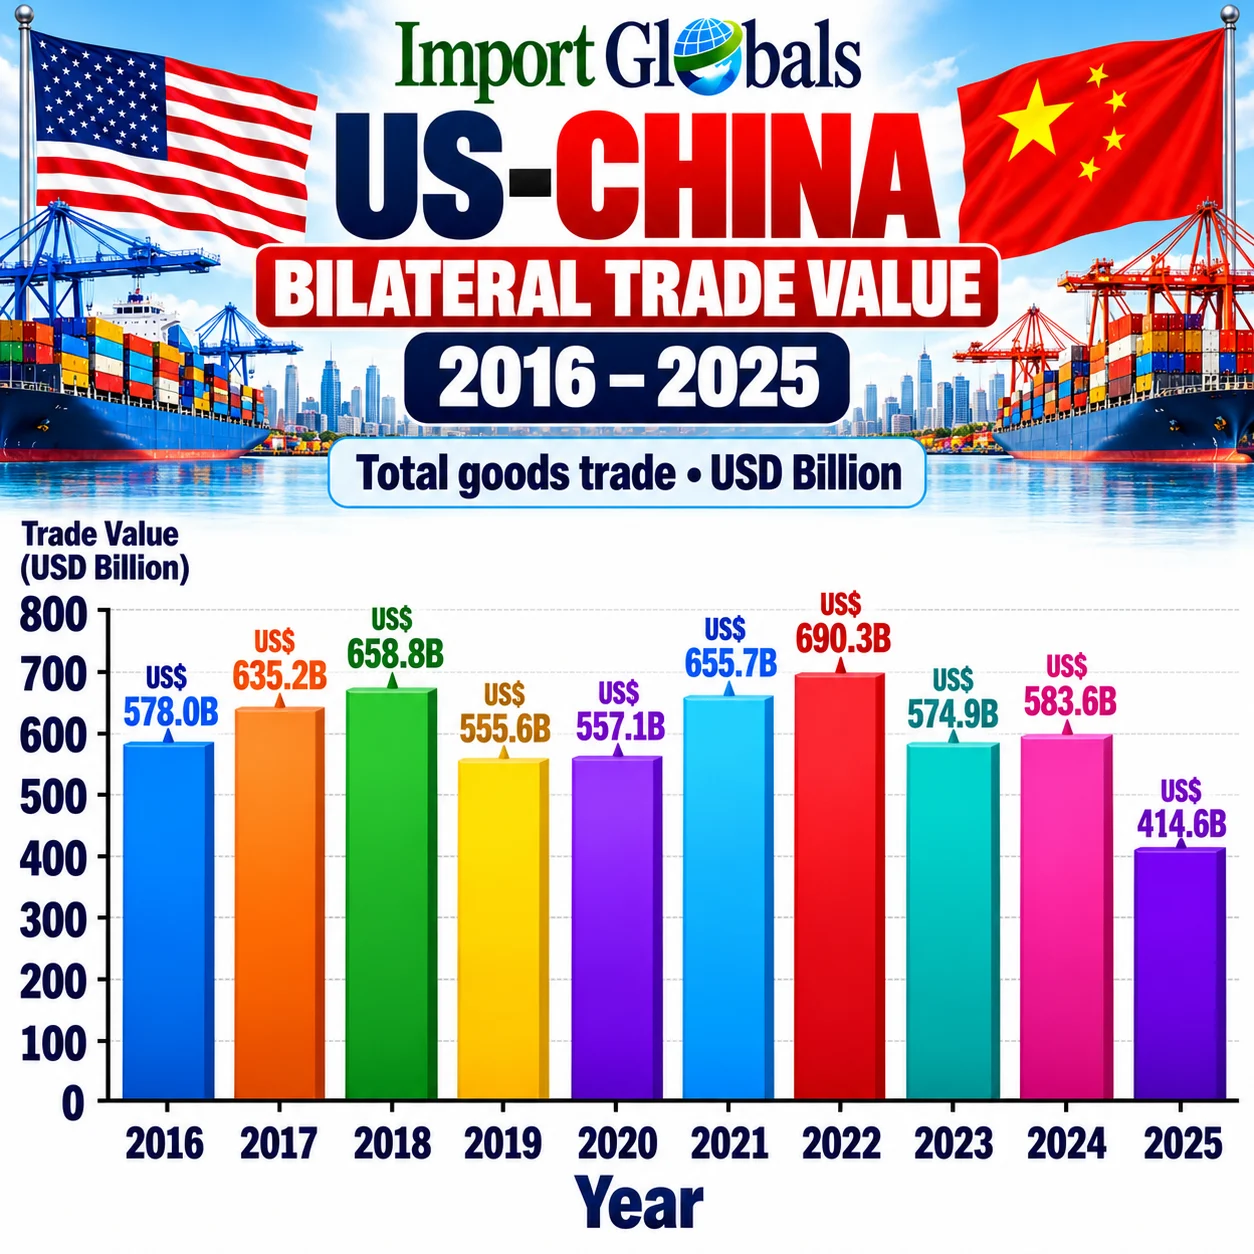
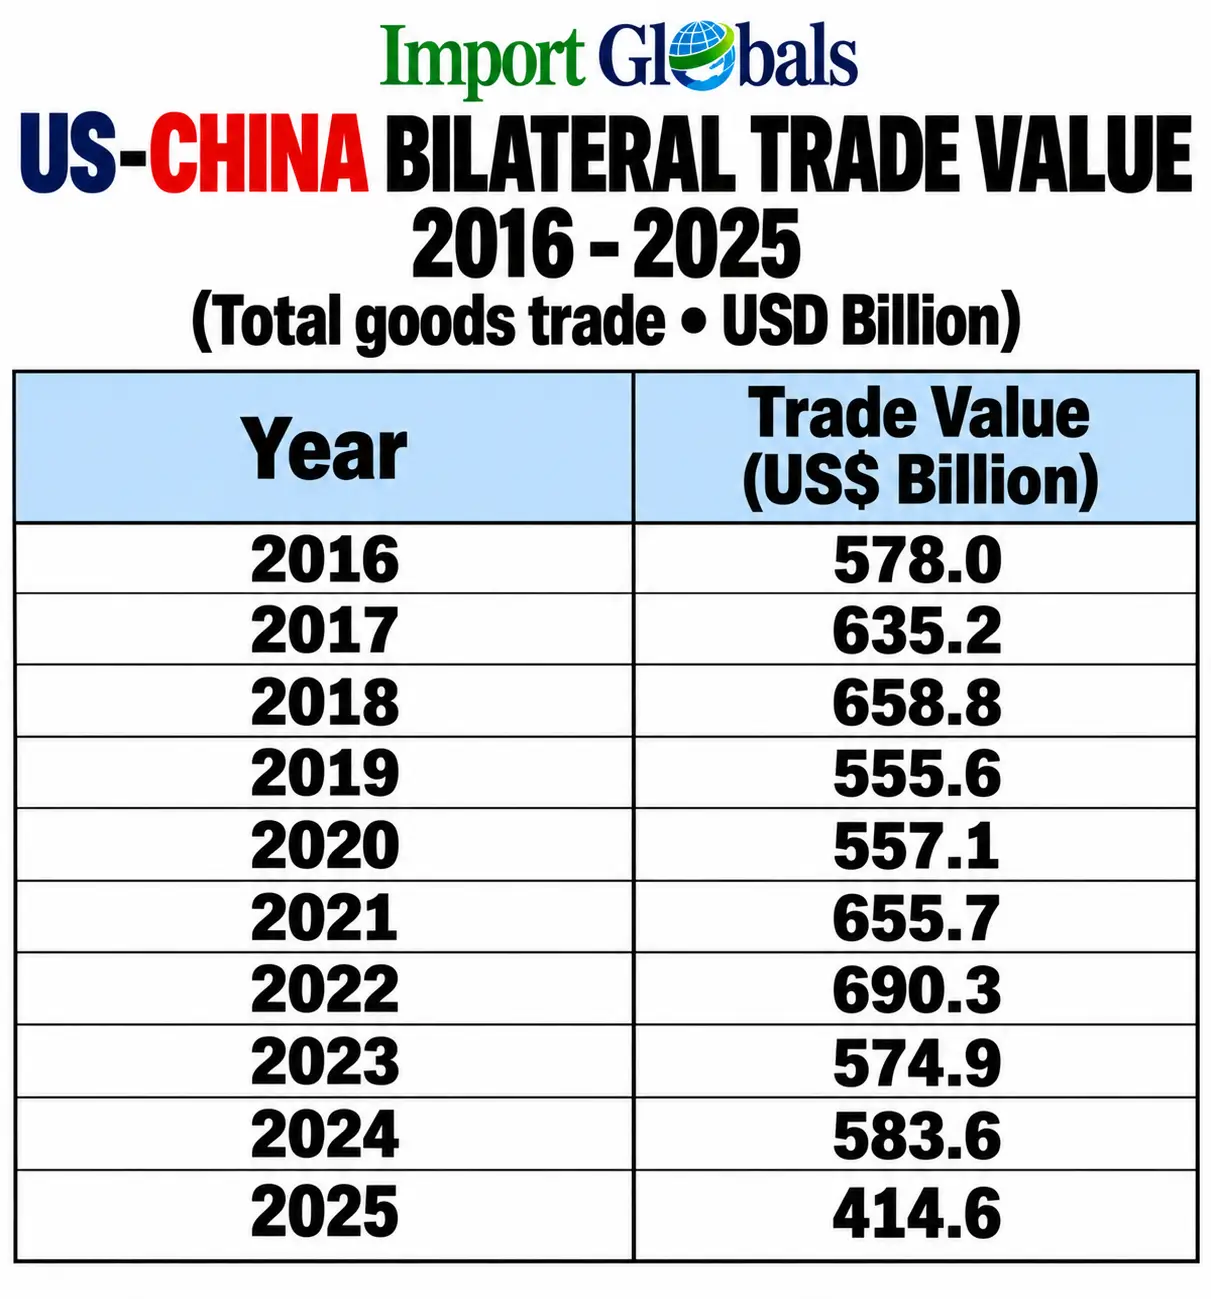
Tariffs From US to China: The Effect of 301 Tariffs on Trade in 2025
- Chinese Imports Fell Dramatically: The United States ' imports of goods from China are at a staggering rate of 308.7 billion U.S. dollars, reflecting a decline of 29.9 percent from the previous year. The monthly statistics are a proper representation of the trade trend. The imports of the nation have totalled a valuation of 41.8 billion in January, while it has decreased by June to a valuation of 18.9 billion U.S. dollars.
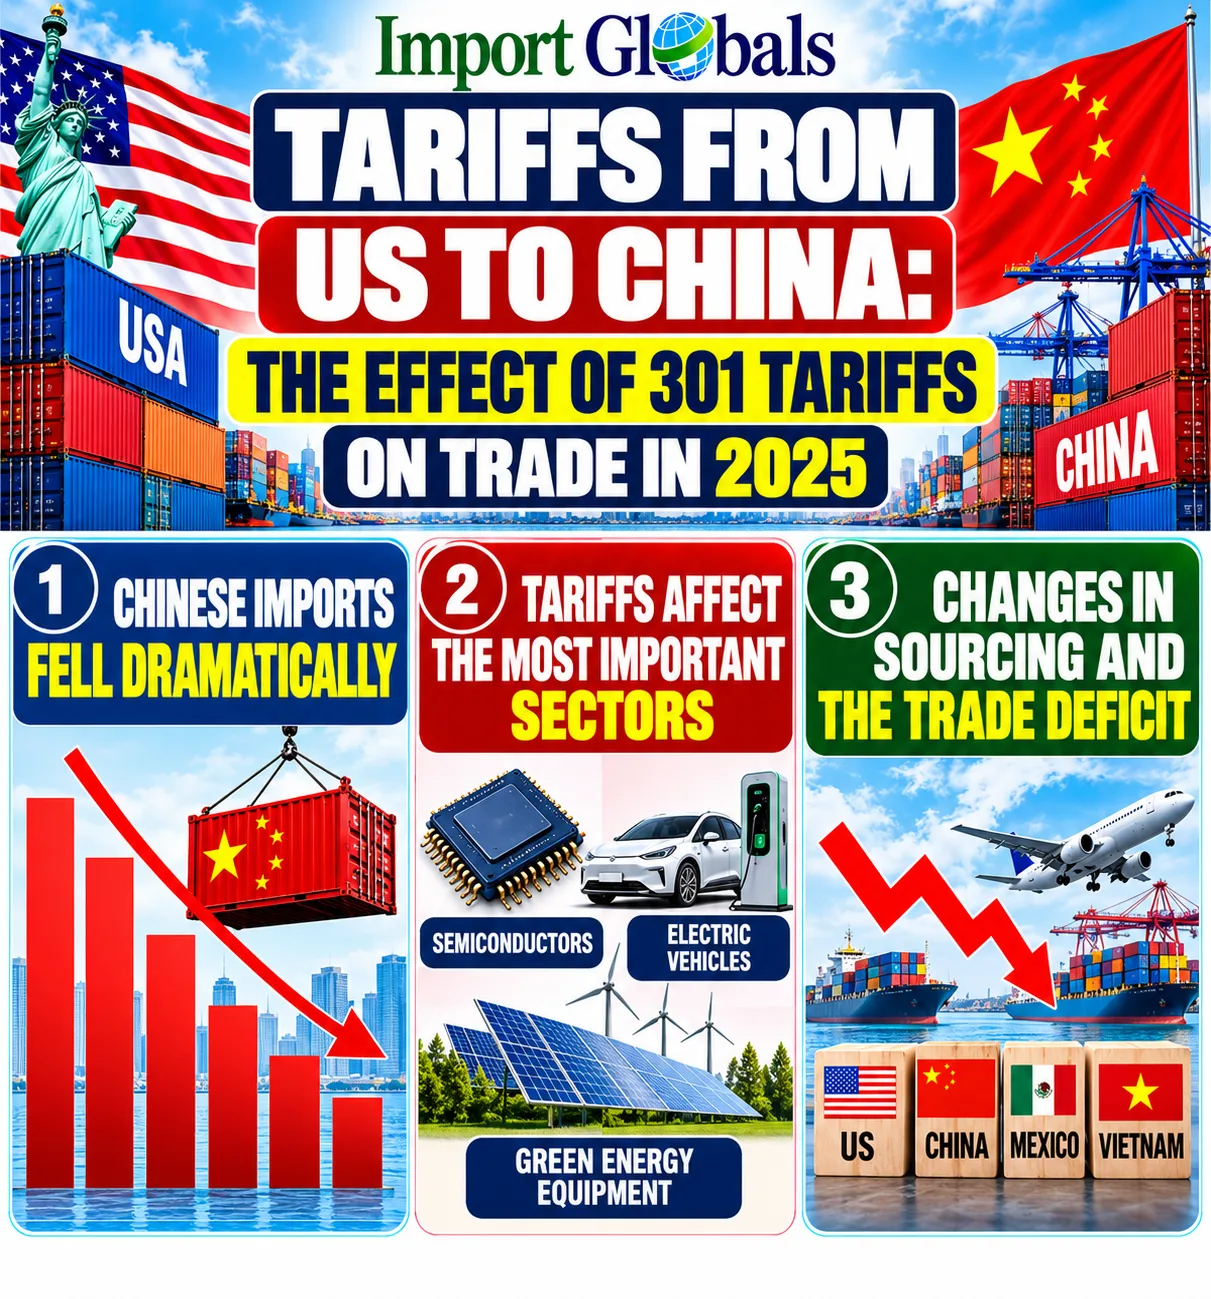
- Tariffs Affect the Most Important Sectors: Section 301 tariffs are mainly imposed on specific sectors including semiconductors, electric vehicles, and green energy equipment. The addition to other tariffs applied has been working in collaboration to control trade disruption within both regions. The information, based on the U.S. Trade Data report, is that customs duties on imports from China will constitute about 122.7 billion U.S. dollars in 2025, with the share of electrical goods making up around 26.9 billion for the same.
- Changes in Sourcing and the Trade Deficit: There are sudden changes in the trade deficit within both economies, while U.S. China trade has decreased by 202.7 billion U.S. dollars. The trade deficit has reportedly decreased by 31.8% in comparison to the previous year. The trade deficit did not disappear but moved to another country, since the US had significant goods trade deficits with Mexico (197 billion) and Vietnam (178 billion) in 2025.